

TailTrack
An AI-powered health tracking system that helps new dog owners understand their dog’s wellbeing through real-time insights, alerts, and guided care.
Timeline
Fall 2025
Tools
Figma, Illustrator, ChatGPT
Revision Team
Faith Innes, Justine Santos, Dorsa Roohbakhsh & Minju Jung
Original Team
Adrienne Luong, Anton Kouznetsov, Jasmine Dacanay
& Long Le
New Design System


Colour Scheme


Typography


H1
H1
Caption
H2
Body
H2
H3
Body 1
#FFE689
#F89E0B
#FF633B
#49CBFF
#CFFC1A
#1F1F22
#F96361
#000000
#FEE2E2
#E4E1DE
Body 2
Takeaways
Working within an established design framework pushed me to identify what aspects of the design were worth preserving and where deeper changes were needed to create a clearer, more user-centered experience. Introducing AI insights and automated alerts also emphasized the importance of transparency and trust, especially when users rely on the product for guidance about their pet’s wellbeing. Reworking the user flow showed me the value of grounding decisions in real user behavior rather than assumptions, simplifying key journeys to reduce friction and support natural routines. Collaborating closely with my team strengthened the outcome, as combining research, design, and strategy perspectives helped create a solution that was both practical and emotionally supportive. Ultimately, this project reinforced that meaningful improvements come from empathetic listening, thoughtful iteration, and a willingness to challenge existing patterns to better serve users.
Interface Redesign

Unclear scale
Scale out of 100%
Shows stats from different type periods
Ears on graph as indicator for the
dog’s well-being
No distinction to separate types of alerts

Different colours to show alert severity
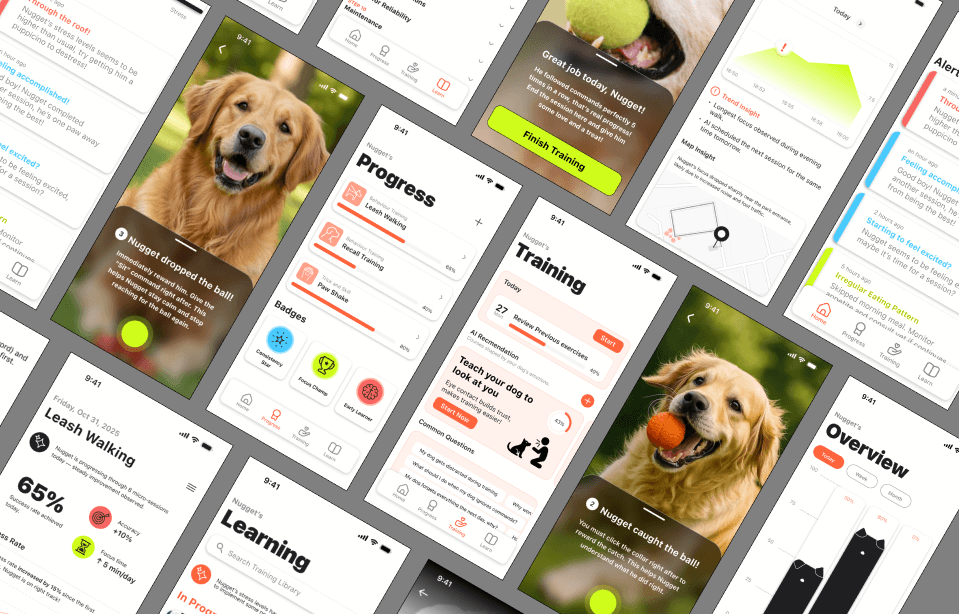
Homescreen
The initial homepage featured a circular diagram to display a pet’s activity and nutrition levels, along with any urgent wellbeing alerts. In the revised version, the diagram is more visually branded and uses a clearer scale, while alerts now employ a distinct color system to indicate the severity of each type.


Unclear scaling
Generic / repetitive graphing system
Use of icons to make stats more visual
Clear percentage scaling system
Gamification & badge system to motivate user
Variety of graphing systems used for
visual clarity
High information density
Progress
The original progress feature relied heavily on line graphs to show a pet’s stress levels throughout the day, along with alerts for peak moments and their causes. In the revised version, we introduced more varied data visualizations and added a badge system to gamify the experience, giving users clearer insights and greater motivation to stay engaged with their training plans.

Very small text with little visual contrast between the content and background
Training progress tracker
Added visual to illustrate what actions the AI is suggesting to the user
FAQ section to support the user’s experience
Generalized AI suggestion
Coaching


Learning
The learning section of TailTrack was introduced as a new feature in the revision of this application. This feature was added to benefit the user in the coaching aspect of the app, using AI to suggest users the best training plans relevant for their pet based on their pets activity, nutrition and stress levels.
AI summary of the user’s pet’s condition with training plan suggestions
AI tells the user how the training plan will specifically benefit their pet
Overview of what the plan entails
Tag system to clearly show aspects of the training plan
Varied categories of training plan suggestions